
Scientific Data Analysis & Visualization (Python)
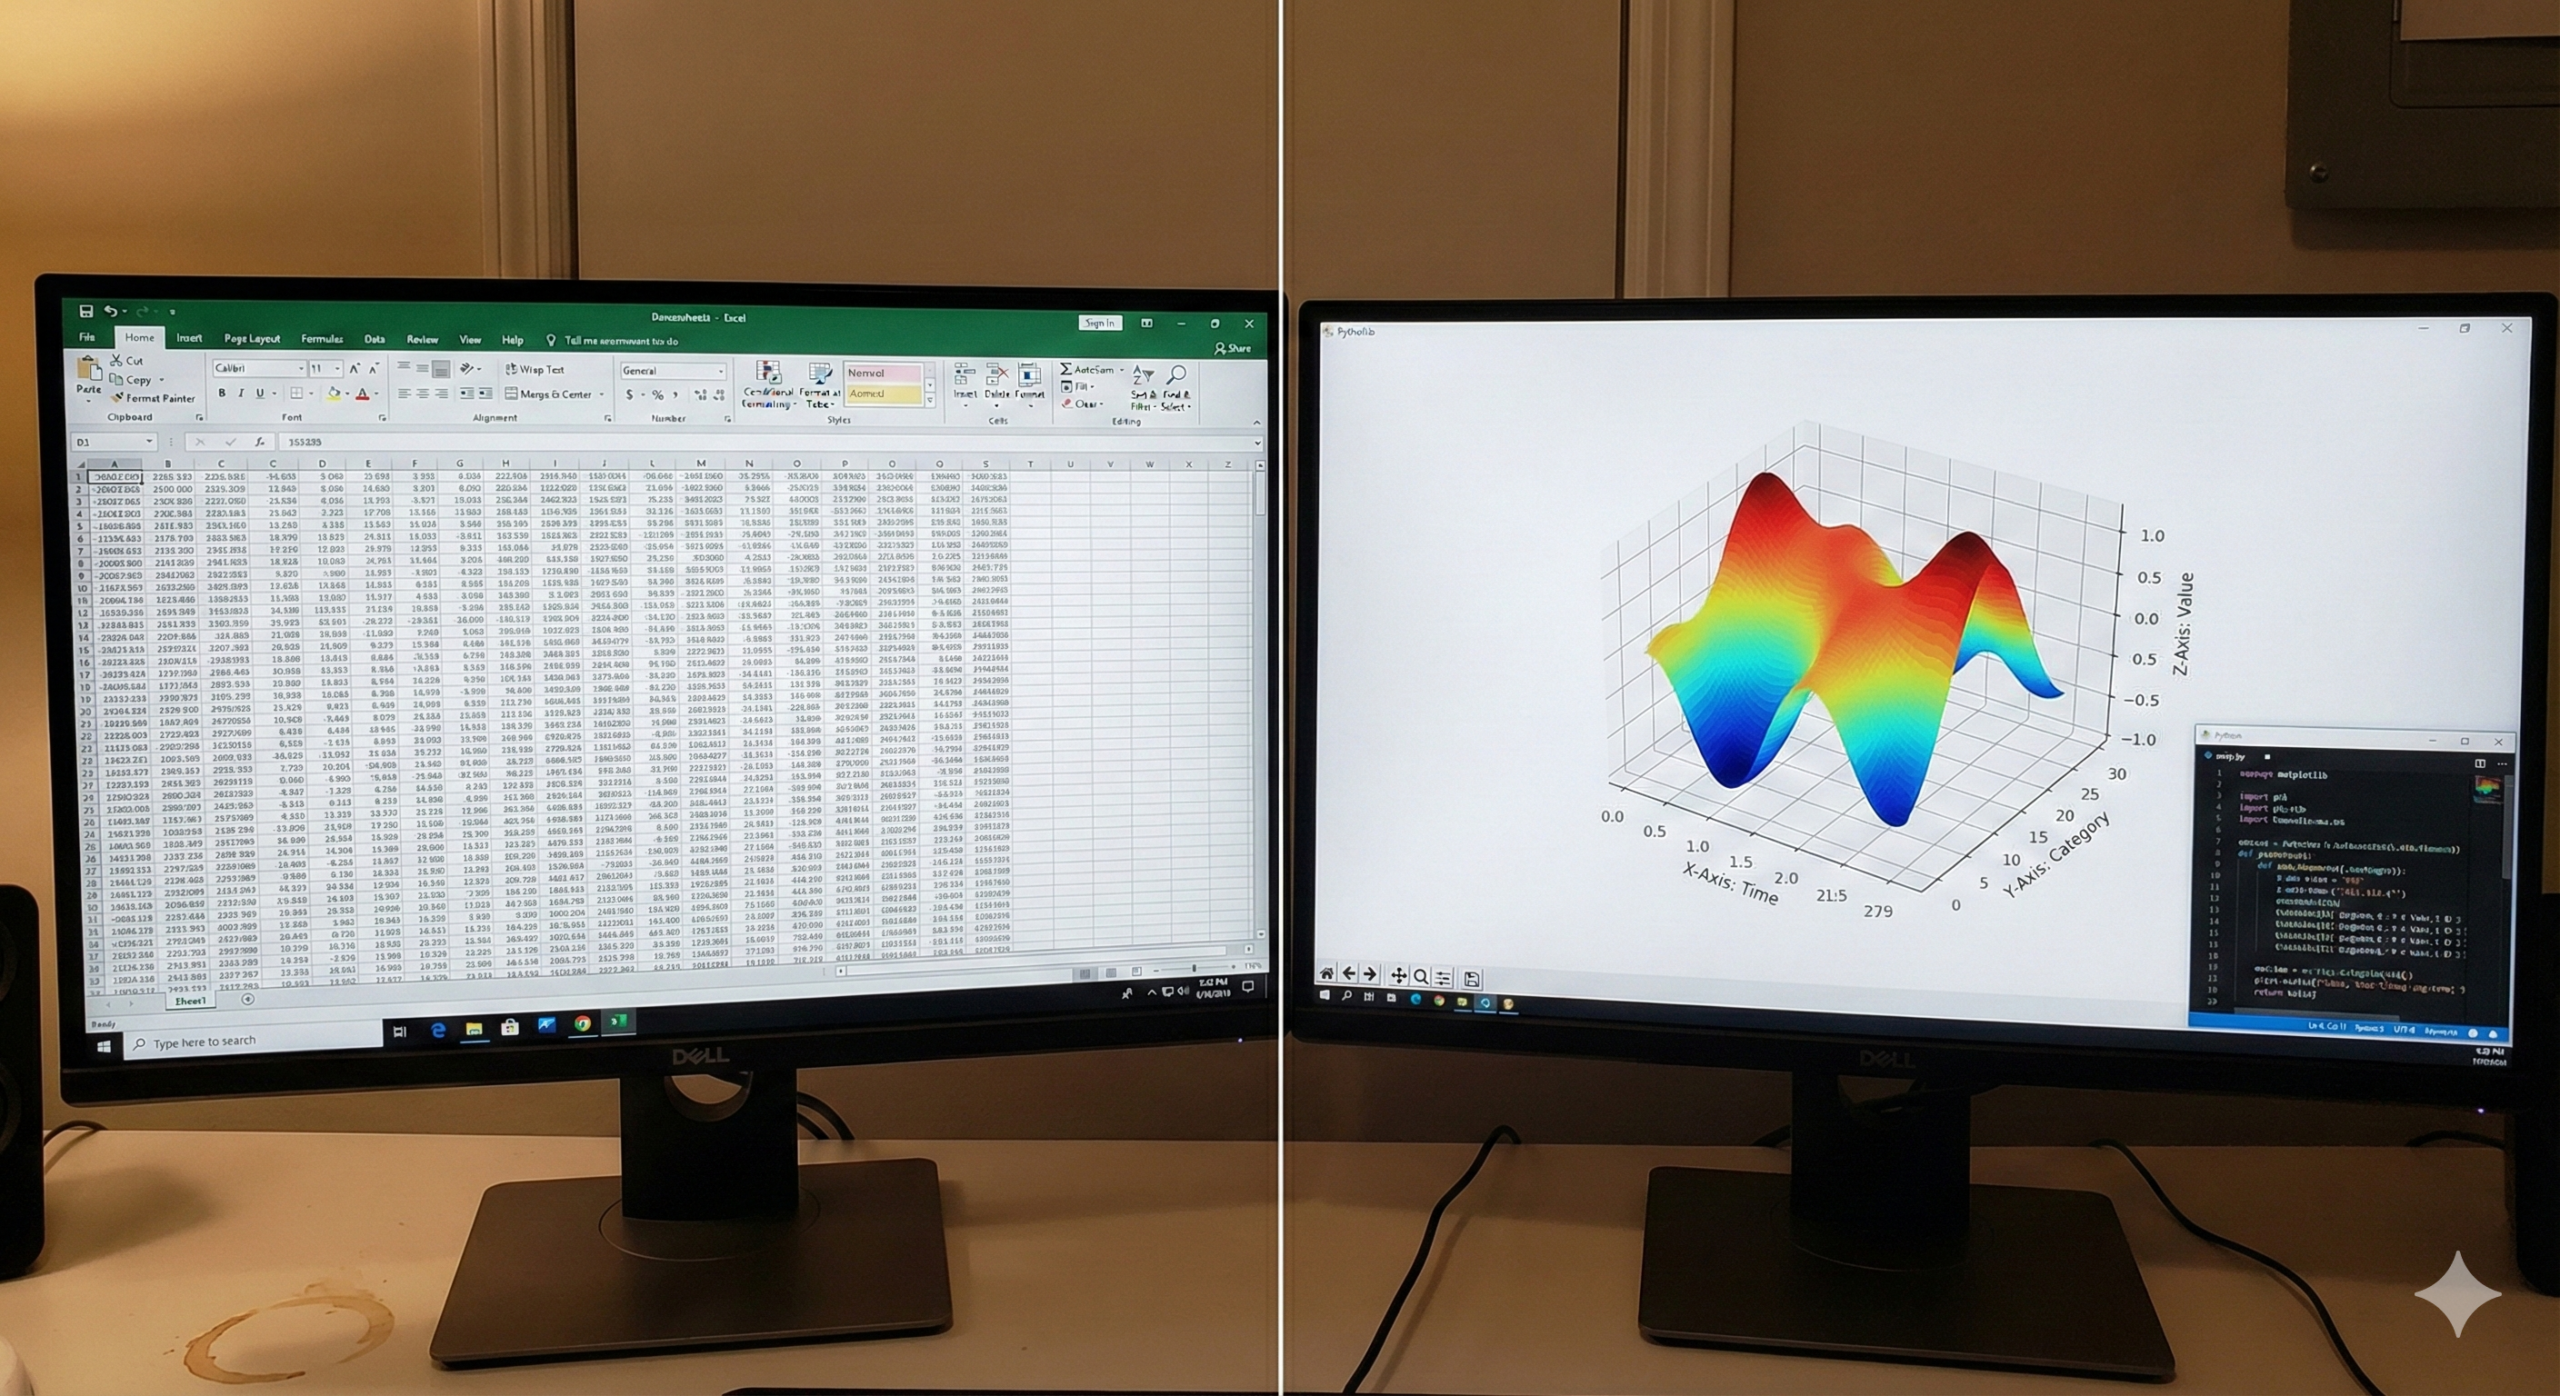
Stop struggling with Excel or OriginLab. I write custom Python scripts (Pandas, NumPy, Matplotlib) to process your raw research data and generate publication-ready plots. Whether it's cleaning massive datasets, running statistical models, or creating complex 3D visualizations, I provide the code and the results.

Code for Researchers.
Academic research produces messy data. I automate the cleaning and visualization process so you can focus on the science.
What I Handle:
- Data Cleaning: Merging, filtering, and normalizing thousands of CSV/Excel rows instantly.
- Custom Plots: High-DPI (300/600 ppi) heatmaps, 3D surface plots, or contour graphs tailored for journals like Elsevier/ACS.
- Statistical Analysis: implementing Scikit-learn or SciPy models to find correlations in your data.
Deliverables:
You get the Source Code (Jupyter Notebook/Google Colabs) and high-resolution Image Files (.PNG/.TIFF).
Related Products

"Code with Me" (2-Hour Live Pair Programming)
Stuck on a bug? Or just want to learn how I code? In this 2-hour live session, we share screens and code together. I don't just tell you what to do; I type it out with you. Perfect for debugging complex Python scripts, fixing Flutter UI issues, or learning best practices in real-time.

Complete SEO Authority Package (Technical + On-Page)
Ranking on Google isn't magic; it's math. I fix the technical errors holding your site back. This package includes a full Technical Audit, Keyword Research (Low Competition/High Volume), Meta Tag Optimization, and fixing Core Web Vitals. I make your site readable for humans and crawlers.

Computational Chemistry (DFT) Server Setup
Setting up ORCA, Psi4, or Gaussian on a Linux server is painful. I handle the complete installation and environment configuration. I configure the parallel processing (MPI) so you can run Geometry Optimizations and Single Point Energy calculations efficiently on your hardware.

Custom Python Automation & Bots
Stop wasting hours on repetitive tasks. I build custom Python scripts, web scrapers, and automation bots tailored to your specific workflow. Whether you need to extract data from complex sites, automate social media actions, or manage large-scale file processing, these tools are built for speed and reliability. Let code do the heavy lifting for you.

Custom WordPress Plugin Development
When off-the-shelf plugins fail, you need custom code. I build lightweight, secure, and performant WordPress plugins from scratch. Whether you need custom database tables, complex third-party API integrations, or bespoke Gutenberg blocks, I provide "GID Studio Grade" code that won't bloat your server or break your site.

Dedicated Technical Virtual Assistant (VA)
Need a hand with the boring stuff? I provide a Technical VA service. Unlike standard VAs, I can handle WordPress updates, Data Entry, Product Uploads, Email Management, and basic Research. Hire me by the hour or get a monthly bucket of hours.